


A bookmarkable reference for in-house experimentation leads who want structure, not guesswork.
Jump to a section
If you think you can get consistent growth by making changes to your website without any real insight, you’re one of three things: delusional, inexperienced, or superhuman.
For the rest of us, doing the groundwork first is non-negotiable.
Here’s the thing those shiny “we got a 300% uplift” blog posts never mention… the pile of failed experiments that came before it and the hours of research that made the winner possible.
Research isn’t the sexy part. So most people skip over it. But your experiments are only as good as the insight you manage to uncover first.
This guide gives you a structured, repeatable process for auditing a website before you touch a single test. Bookmark it. Come back to it. Use it every time.
Before You Start: The Mindset Shift
An audit isn’t a checklist you rush through. It’s a diagnostic process. Closer to what a doctor does than what a developer does.
You’re not looking for things to fix. You’re looking for constraints – the structural bottlenecks that, once removed, create the most leverage.
That framing matters because it changes where you look, what questions you ask, and how you present your findings to stakeholders.
Step 1: Run a Strategy Session First
Before you open a single analytics tool, get in a room (or a call) with the business.
The goal is simple, understand what actually matters. Jumping straight into form optimisation when shopping cart abandonment is the real problem is a massive waste of time, money, and trust.
Questions worth asking:
- Why do people buy your product or service?
- What product or service generates the most revenue?
- What’s the current process from lead to paying customer?
- How much does it currently cost to acquire a new customer?
- Where do deals fall apart?
Some of these feel intrusive. Ask them anyway. Almost every business owner cares about revenue, so knowing these numbers means you can speak directly to what keeps them up at night.
And for the record, a 30% uplift in webinar registrations is a much harder sell than a 30% increase in MRR. Stay close to the money.
Step 2: Audit Your Tag Management Setup
Before you can do anything meaningful with data, you need to know your tracking is actually working.
Start with Google Tag Manager (GTM). If it’s installed, great – it makes deploying other tools significantly easier without dragging in a developer every time.
Two browser extensions worth having:
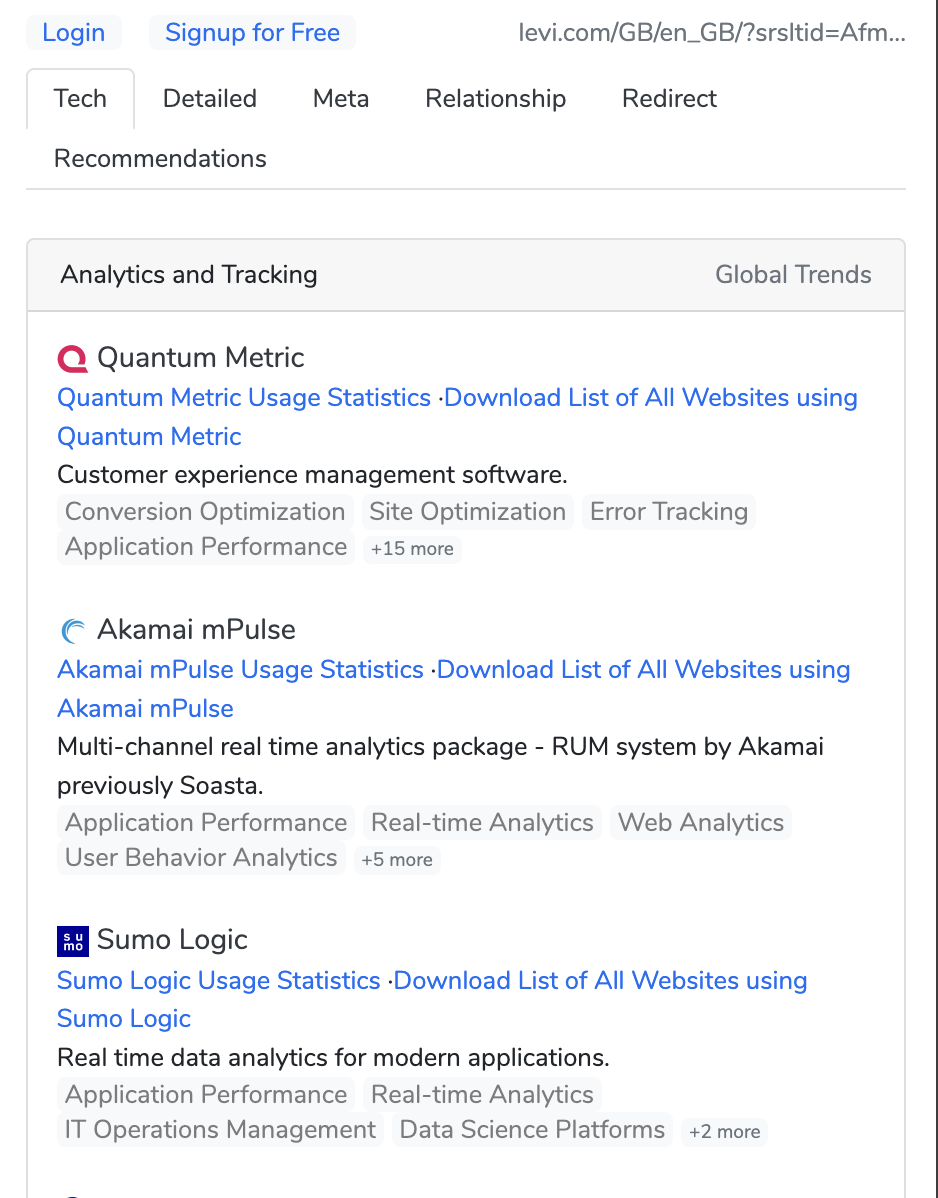
These take seconds and tell you a lot about what you’re working with – including whether the business is already running an experimentation tool, which is useful context for everything that follows.
If GTM isn’t installed, that’s your first recommendation. Add the code snippet before the closing </head> tag and after the opening <body> tag, verify it’s firing, and move on.
Step 3: Audit Your Analytics Setup
Once you know what’s installed, you need to assess whether it’s actually configured correctly. An analytics tool that’s firing but misconfigured is worse than useless — it gives you false confidence.
What to check:
- Are goals or conversion events set up?
- Is the tracking firing on the right pages?
- Are there obvious gaps (e.g., checkout steps not tracked, internal traffic not filtered)?
- Is there clean historical data to work with?
A note on tooling:
GA4 is the default for most businesses by default or by inertia. And if it’s already in place with historical data, it’s worth using — but go in with your eyes open. GA4 has a steep learning curve, a session model that takes some getting used to, and a UI that frequently frustrates even experienced analysts. It’s powerful if you know it well. If you don’t, expect friction.
PostHog is increasingly worth considering, particularly for product-led SaaS businesses. It gives you behavioural analytics, session replays, funnel analysis, and feature flag support in one place — and the free tier is genuinely usable. It’s built for teams who want depth without needing to piece together five different tools. If the business is open to tooling changes, it’s a strong recommendation.
Either way, the audit should surface data quality issues and configuration gaps before you try to draw conclusions from the numbers.
Step 4: Analyse Traffic Sources and Channel Performance
Now you’re into the data. The first question: where is traffic actually coming from, and which sources are doing meaningful work?
Look at your channel breakdown and ask two distinct questions:
- Which channels send the most traffic?
- Which channels send the most qualified traffic?
These are not the same thing. A channel can drive huge volume with terrible conversion rates, or low volume with exceptional intent. Both matter — but they suggest very different interventions.
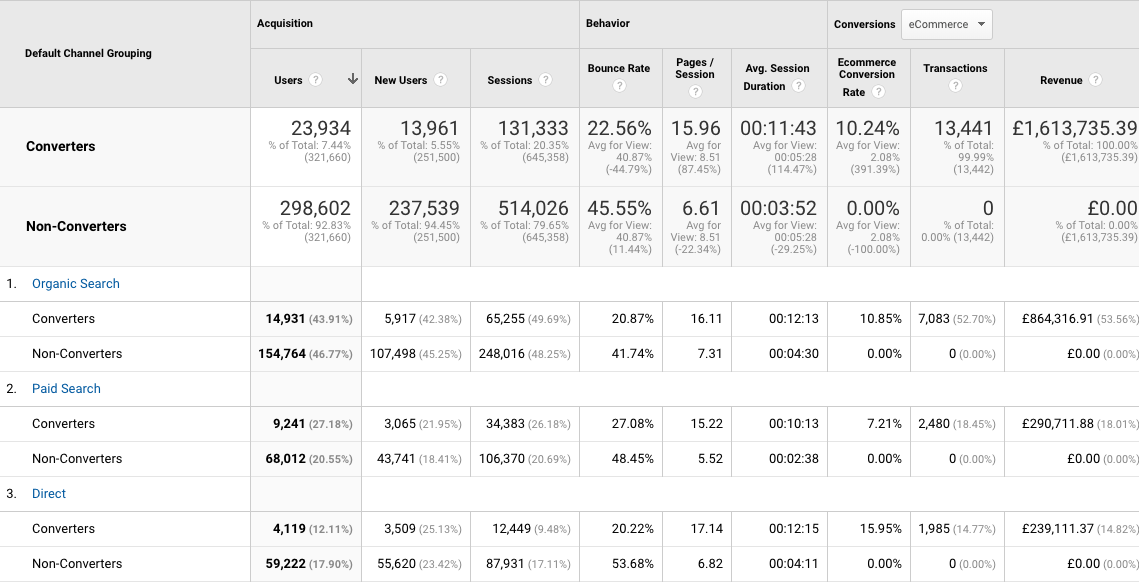
Segments worth running:
- Converters vs. Non-Converters
- Mobile vs. Desktop
- New vs. Returning
Look for patterns across these. High bounce rates from a specific channel usually mean either the wrong audience is being sent, or the landing experience doesn’t match what was promised in the ad or link.
Also watch for weekly or monthly traffic spikes. If you see one every Thursday, find out why. Is it an email send? A recurring campaign? Understanding the rhythm of the site helps you avoid misreading seasonal patterns as structural problems.
Step 5: Review Landing Page Performance
The landing page report tells you where visitors first arrive and how those pages actually perform.
For the top 10 landing pages, look at:
- Volume (sessions)
- Engagement (bounce rate, time on page)
- Conversion rate (if goals are configured)
Are there patterns in terms of topic, content type, or page location? What’s working, and why? Which high-traffic pages have surprisingly poor engagement and which low-traffic pages punch above their weight on conversion?
If you’re working on a content-heavy site, filter by URL subfolder (e.g., /blog/) to isolate specific sections. Then add a secondary dimension of source/medium to understand which channels are driving performance on each specific page – not just the site overall.
Set these as your benchmarks. If this is the first audit, these numbers are your baseline. The goal over the next quarter is to move them in the right direction.
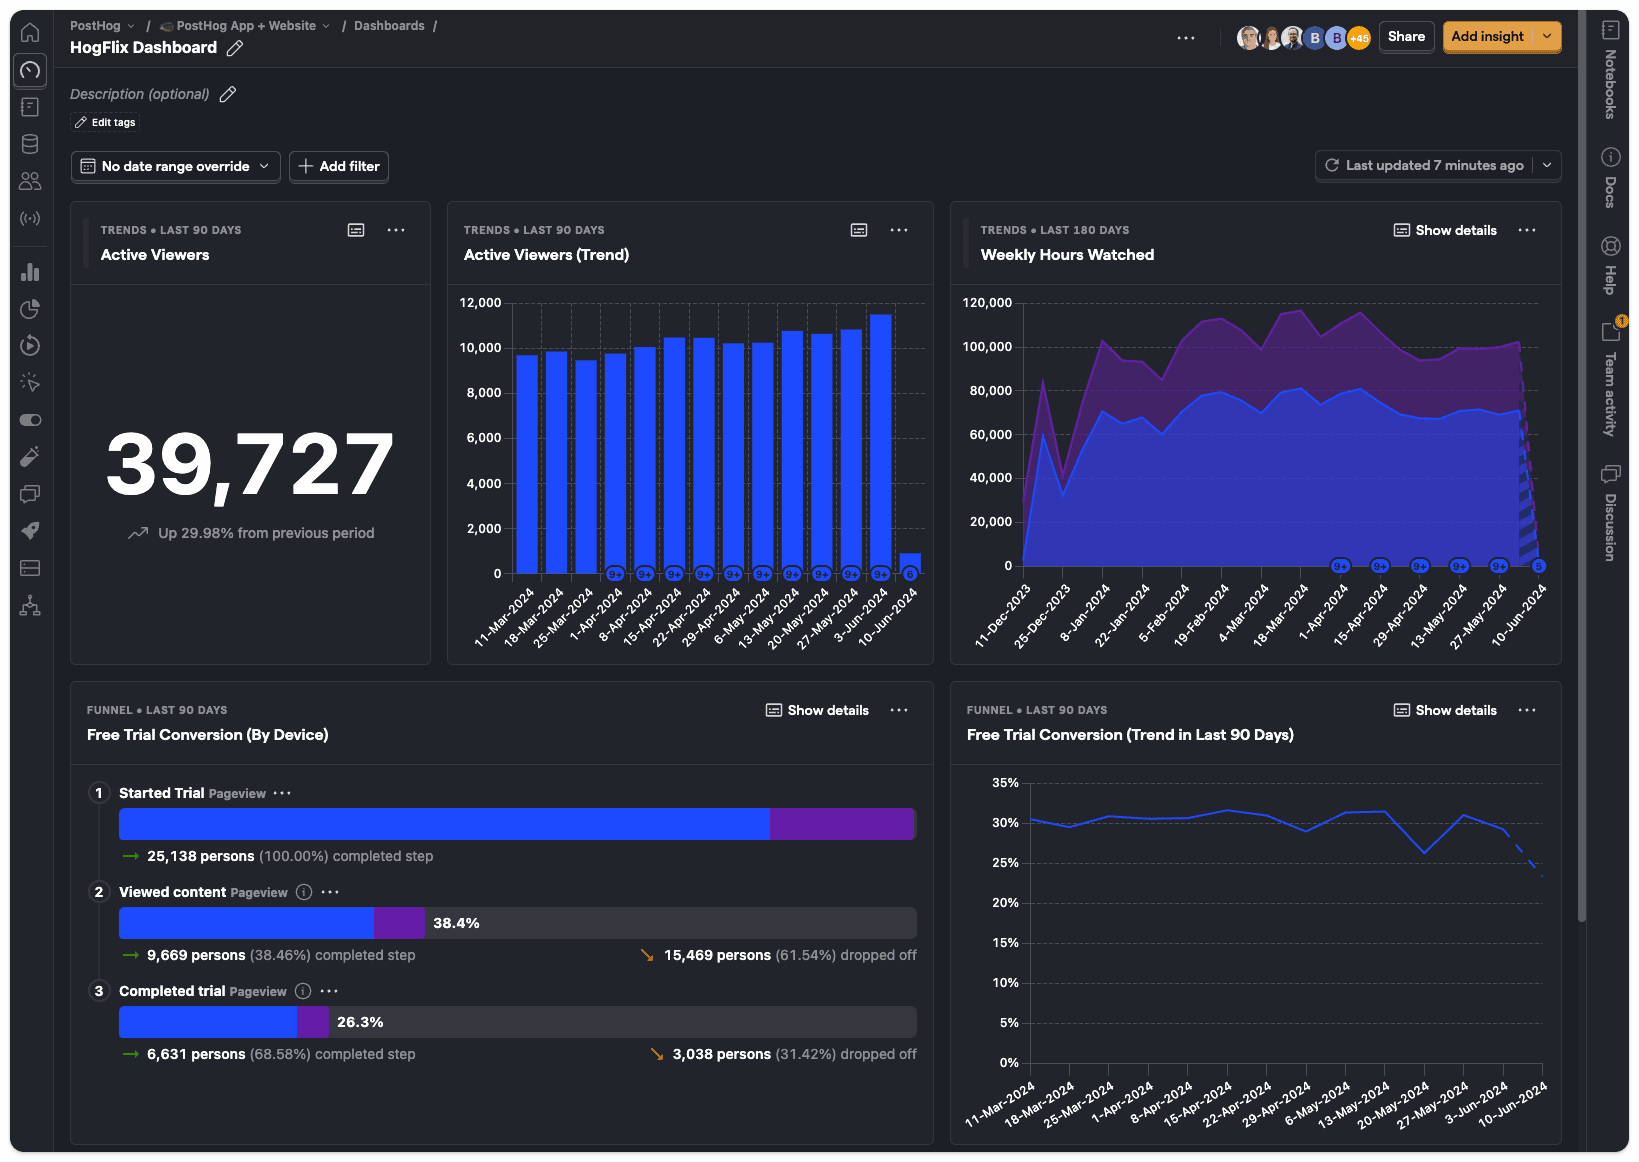
Step 6: Identify Exit Points and Drop-Off
Where are people leaving and is it a problem?
Not every exit is bad. Someone who reads your pricing page and then emails you isn’t a drop-off, they’re a conversion. Context matters.
But exits on high-intent pages like checkout steps, sign-up flows, or key product pages… they’re worth digging into.
Look at:
- Top exit pages by volume
- Exit rate relative to the page’s position in the funnel
- Pages where exit rate is high but shouldn’t be (e.g., mid-checkout)
These are often where the biggest opportunities sit, precisely because they’re further down the funnel where intent is already established.
Step 7: Review Mobile vs. Desktop Behaviour
This is often where significant gaps hide. Particularly in B2B SaaS where most content is consumed on mobile but conversion happens on desktop.
What to look at:
- Traffic split between mobile and desktop
- Conversion rate by device
- Bounce rate by device
A high mobile bounce rate on landing pages that receive significant paid or social traffic is a common finding. The cause isn’t always obvious. It could be page speed, layout, CTA placement, or a mismatch between the ad creative and the landing experience. The audit surfaces the problem, the research in later steps helps you understand why.
Step 8: Search Query and Intent Analysis
If SEO traffic is meaningful for this business, look at what people are actually searching for when they find the site.
Connect Google Search Console and look at:
- Queries driving impressions vs. clicks (high impression, low CTR = a meta/title opportunity)
- Queries where rankings are sitting between position 5–15 (often the easiest wins)
- Queries that don’t match the page content well (intent misalignment)
Also look at on-site search data if the business has a search function. What people search for when they’re already on the site is one of the clearest signals for what they can’t easily find – which is gap data you can take directly into test ideation.
Step 9: Heatmaps, Session Recordings, and Scroll Depth
Quantitative data tells you what is happening. Behavioural data starts to tell you why.
Tools like Hotjar, Microsoft Clarity (free), or PostHog’s session replays let you watch how real users interact with pages, where they click, how far they scroll, where they hesitate or rage-click.
For an initial audit, focus session recordings on your highest-traffic or highest-value pages. You’re looking for:
- Rage clicks (people clicking things that aren’t clickable)
- Drop-off before key CTAs
- Scroll depth below important content
- Confusing navigation patterns
This is also where you start forming hypotheses. Not test ideas, but structured assumptions about why a pattern exists.

Step 10: Voice of Customer Research
No audit is complete without hearing from actual customers. Data patterns show you what’s happening. Customers tell you why.
Two approaches depending on budget and access:
Surveys: on-site surveys (via tools like Content Square or Sprig) can capture intent and friction in real time. Exit surveys are particularly useful: “What stopped you from completing your purchase today?” is a question that pays for itself.
User testing: live or recorded testing sessions with real users navigating key flows. The value here isn’t just the insights, it’s the format. Stakeholders who are sceptical of data often respond strongly to watching a real person struggle with their product. Video feedback is hard to argue with.
If you can only do one, run an on-site survey on your highest-exit, highest-intent page. Even five responses will shift your thinking.
Step 11: Technical and Speed Audit
Performance issues aren’t just a developer problem. A one-second delay in page load time can really reduce conversions, particularly on mobile. Before you test anything, rule out the possibility that slow load times or broken functionality are quietly sabotaging the results.
Tools to use:
- Google PageSpeed Insights: free, gives you a Core Web Vitals breakdown
- GTmetrix: more detailed diagnostic, useful for identifying specific culprits
- Browser DevTools: for checking console errors, broken scripts, or layout shifts
Look specifically at:
- LCP (Largest Contentful Paint) – how quickly the main content loads
- CLS (Cumulative Layout Shift) – content jumping around as the page loads
- Console errors that might be silently breaking functionality
A site with significant technical debt isn’t ready for experimentation. Fix the floor before you start building.
Step 12: Synthesise Into a Useful Report
This is where most audits go wrong. You’ve got a mountain of data. The temptation is to share all of it.
Don’t.
Your job is to turn data into decisions. And decisions require clarity, not comprehensiveness.
A good audit report does three things:
- Answers the questions from Step 1 directly, early, and in plain language
- Groups findings into themes not a long list of issues, but 3-5 structural constraints that, if addressed, would move the needle most
- Prioritises ruthlessly based on potential impact, confidence in the finding and ease of implementation
Think about who’s reading it. If it’s going to a data-literate CRO team, you have more latitude. If it’s going to a CMO or commercial director, lead with the business implication first and let the data support it.
The visual presentation matters too. Mix data, insight, and clear recommendations. Use simple visuals to orient people before diving into tables. And above all, make it scannable. If someone has to work hard to understand what you’re recommending, the audit hasn’t done its job.
The Short Version
| Step | Focus |
|---|---|
| 1 | Strategy session — understand what matters commercially |
| 2 | Tag management audit — confirm tracking is in place |
| 3 | Analytics setup review — assess data quality and configuration |
| 4 | Traffic and channel analysis — where’s the quality traffic coming from? |
| 5 | Landing page performance — what’s working and what isn’t? |
| 6 | Exit point analysis — where are people leaving and why? |
| 7 | Device behaviour — is the mobile experience a hidden constraint? |
| 8 | Search query analysis — what are people looking for that they can’t find? |
| 9 | Heatmaps and session recordings — what does behaviour actually look like? |
| 10 | Voice of customer — what do real users say? |
| 11 | Technical and speed audit — is the foundation solid? |
| 12 | Constraint-led report — synthesise into clear recommendations |
A well-run audit doesn’t just give you a list of things to test. It gives you a ranked view of where the real leverage is… so that when you do run experiments, they’re grounded in evidence, not instinct.
That’s how you move from running tests to running a programme.
Looking to run your first structured CRO audit? Book a Conversion Clarity Call and we’ll work through your site together.


3 Comments